Top Forex trading tools and indicators to help you make better trades
What Are Indicators?
Indicators are tools used by traders to understand and predict market movements. They are based on mathematical formulas that analyze past price data, such as how much a currency pair has moved up or down over time. These tools display patterns on charts, making it easier for traders to spot trends and make informed decisions. Indicators help traders estimate whether prices might rise or fall, how strong the current trend is, and whether the market is moving quickly or slowly.
There are many types of indicators used in forex trading. For example, moving averages (MA) smooth out price data by showing the average price over a specific period. This helps traders identify the overall direction of the trend. The relative strength index (RSI) measures the speed and change of price movements. It shows whether a currency is overbought (which may signal a possible price drop) or oversold (which may indicate a potential price increase).
Another common indicator is the moving average convergence divergence (MACD). It helps traders spot changes in momentum by comparing two moving averages. Bollinger Bands are also widely used—they create a band around the price chart that shows how much the price is moving up or down. When the bands are far apart, it indicates high market volatility, while narrow bands suggest low volatility.
While indicators provide useful insights, they are not foolproof. Market conditions change unexpectedly, making it risky to rely on just one indicator. That’s why many traders combine multiple best Forex trading tools and indicators to confirm their predictions and reduce the chances of making incorrect trades.
What Are Forex Indicators?
Forex indicators are specific tools designed for the foreign exchange (forex) market. They help traders track and analyze currency price movements by identifying patterns and trends. These indicators use historical data, such as price and volume, to create signals that traders use to make decisions. When applied to forex charts, these indicators reveal whether a currency pair is likely to continue moving in the same direction or if a reversal might happen.
For example, if a forex indicator shows that a currency pair is overbought, it might suggest that the price could soon fall, as traders may start selling. On the other hand, if the indicator signals that the currency is oversold, it could mean that the price may rise, as traders may begin buying. Forex traders often rely on these signals to decide when to enter or exit trades.
By using effective forex trading tools and indicators, traders increase their chances of making smarter and more profitable decisions. However, it is important to remember that no indicator guarantees success. Therefore, combining different indicators and applying proper risk management strategies is key to successful forex trading.
Top 10 Forex Indicators for Forex traders
When trading forex, it’s important to use the right tools to understand market trends and make better decisions. Forex indicators help traders identify price movements, spot trends, and find potential entry and exit points. By using these indicators, traders reduce risks and improve their chances of making successful trades.
In this guide, we’ll explore the top 10 forex indicators that FX traders use to analyze the market and make smarter trading decisions.
1. Moving Average (MA)
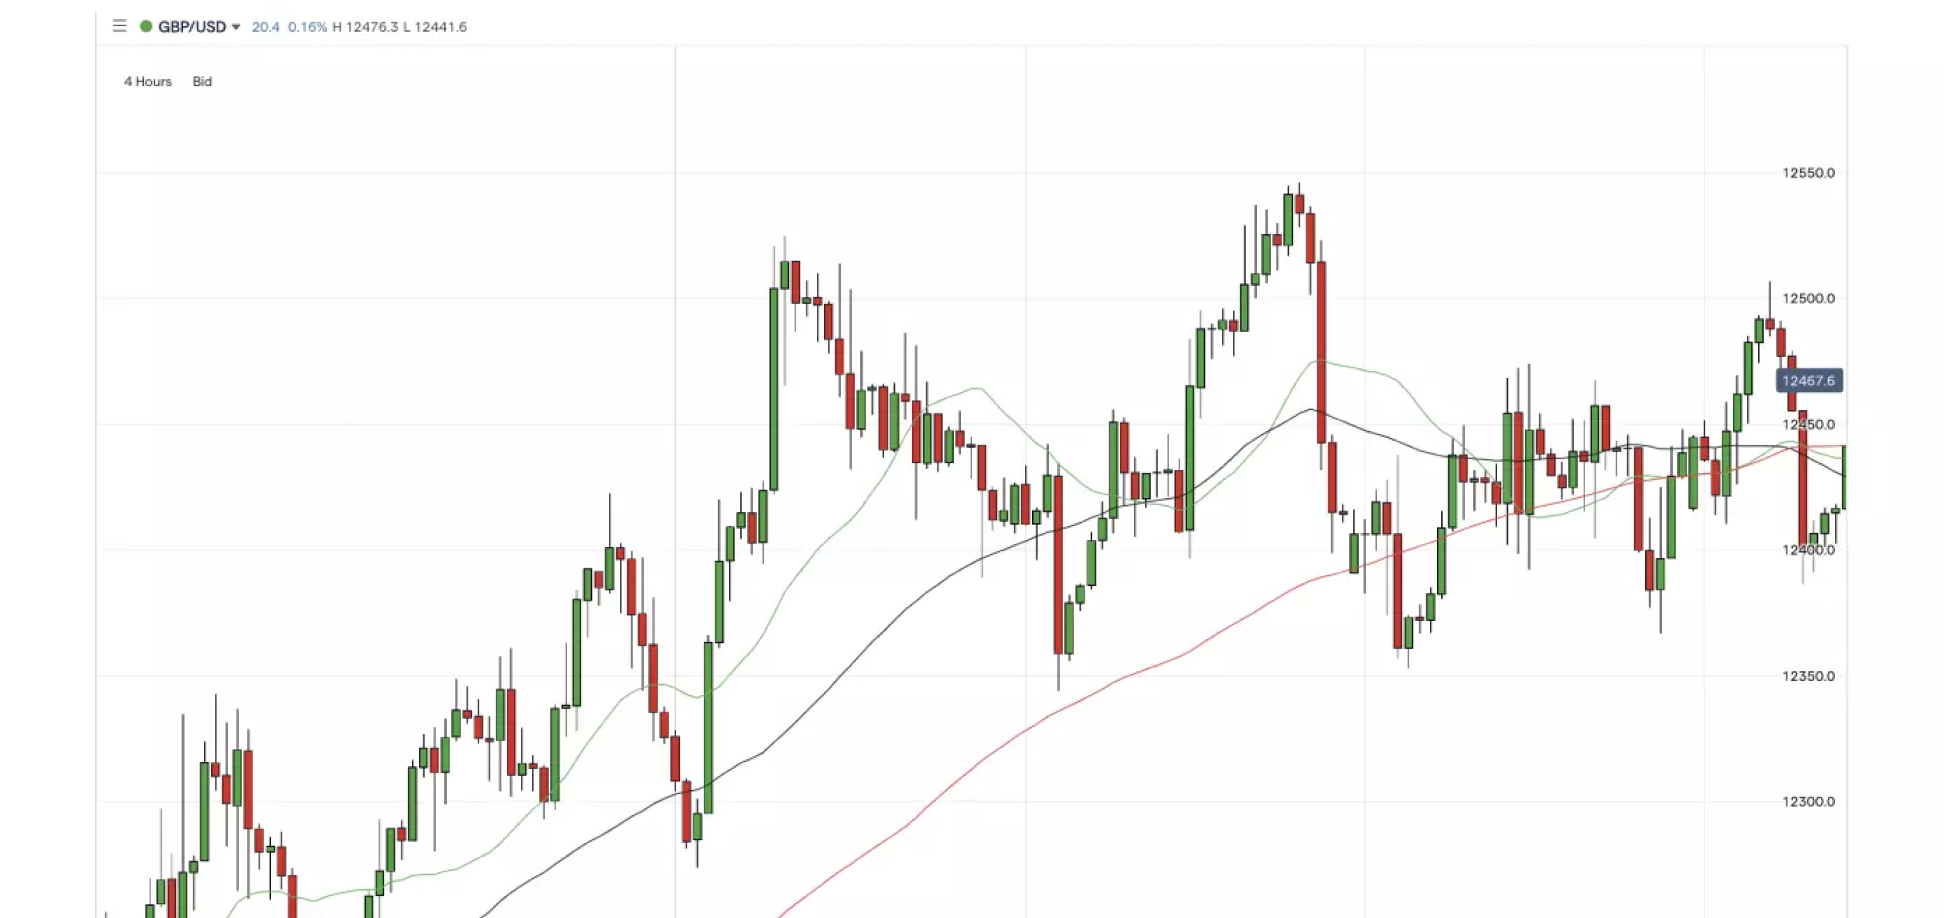
The moving average (MA) is a popular tool used in forex trading to identify the direction of the market trend. It calculates the average price of a currency pair over a specific period, making it easier to spot whether the price is moving up or down. The MA smooths out price fluctuations, helping traders focus on the overall trend rather than short-term movements.
There are different types of moving averages, such as the simple moving average (SMA) and the exponential moving average (EMA). The SMA gives equal importance to all prices during the chosen period, while the EMA gives more weight to recent prices, making it more responsive to current market conditions.
Traders use MAs to find potential entry and exit points. For example, if the current price moves above the moving average, it might signal an uptrend. On the other hand, if the price falls below the MA, it could indicate a downtrend. Many traders combine short-term and long-term MAs to confirm their signals and reduce the risk of false predictions.
2. Bollinger Bands
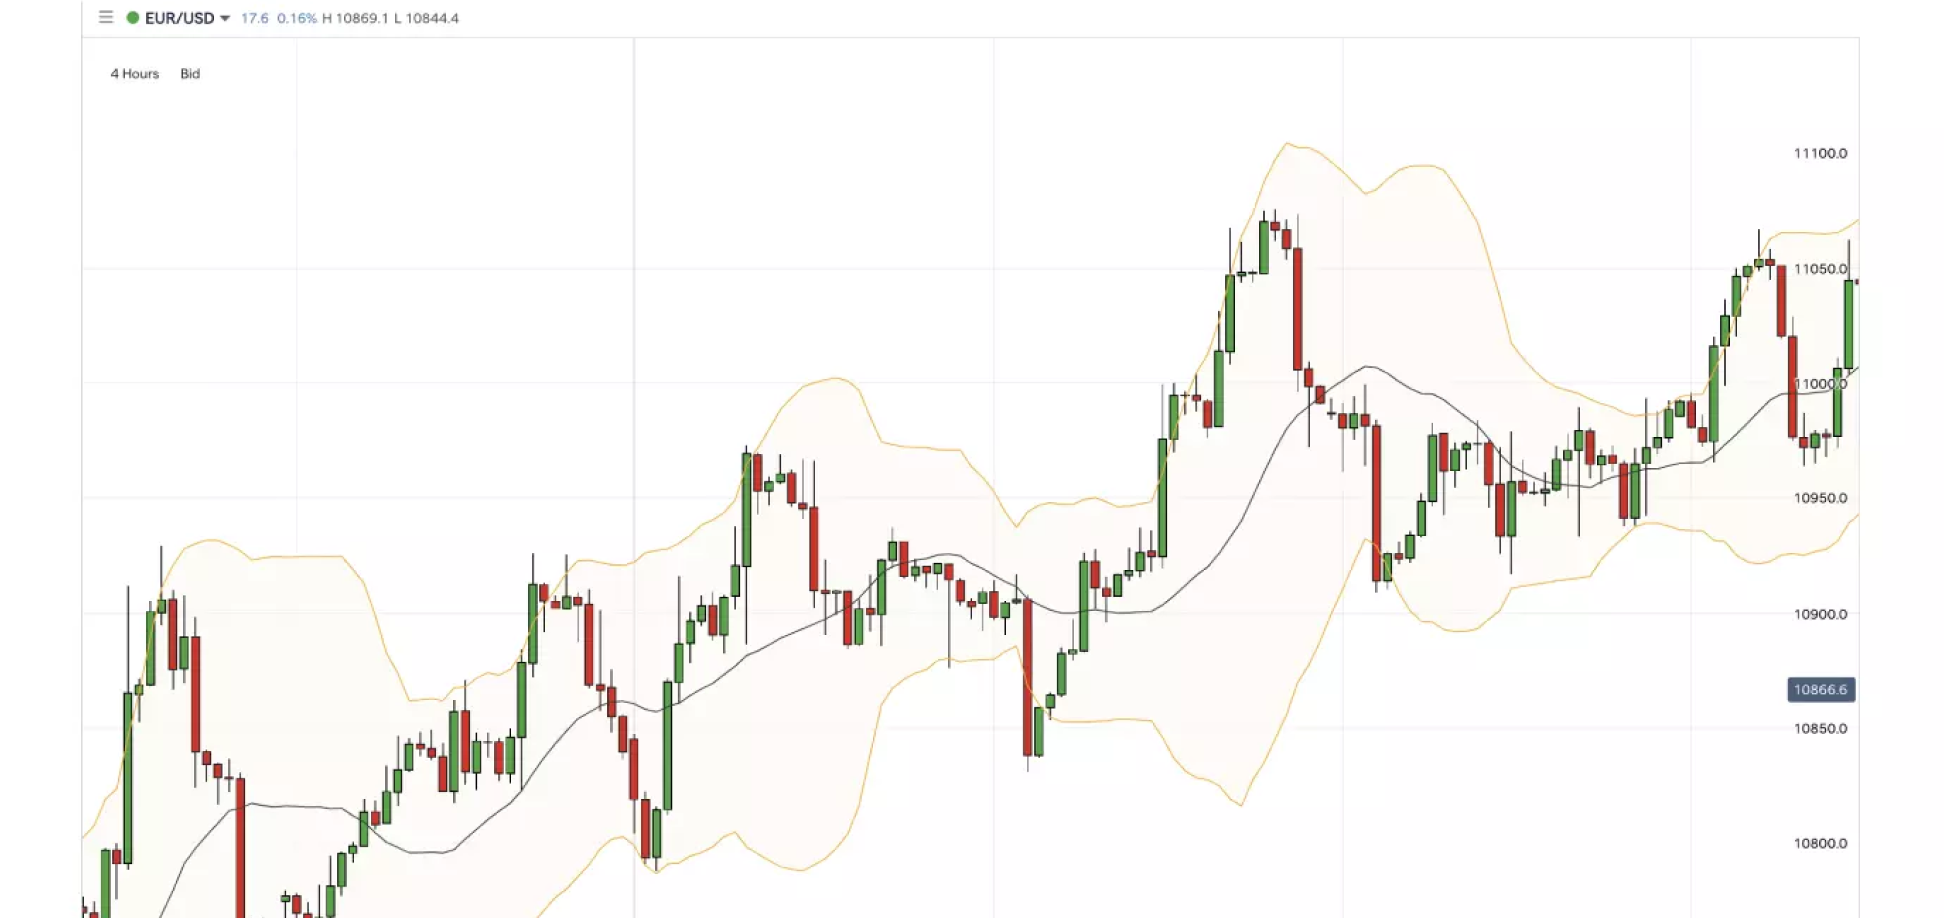
Bollinger Bands help traders measure market volatility. This indicator consists of three lines: a middle band (which is a moving average) and two outer bands that expand and contract based on market volatility. When the market becomes more volatile, the bands widen. When the market is stable, the bands narrow.
If the price moves outside the upper or lower band, it may indicate that the market is overbought or oversold. When the price crosses above the upper band, it could signal a potential reversal or a continuation of the trend. Similarly, if the price drops below the lower band, it might indicate a buying opportunity.
Bollinger Bands are commonly used for breakout trading, where traders look for price movements beyond the bands as potential trading signals.
3. Average True Range (ATR)
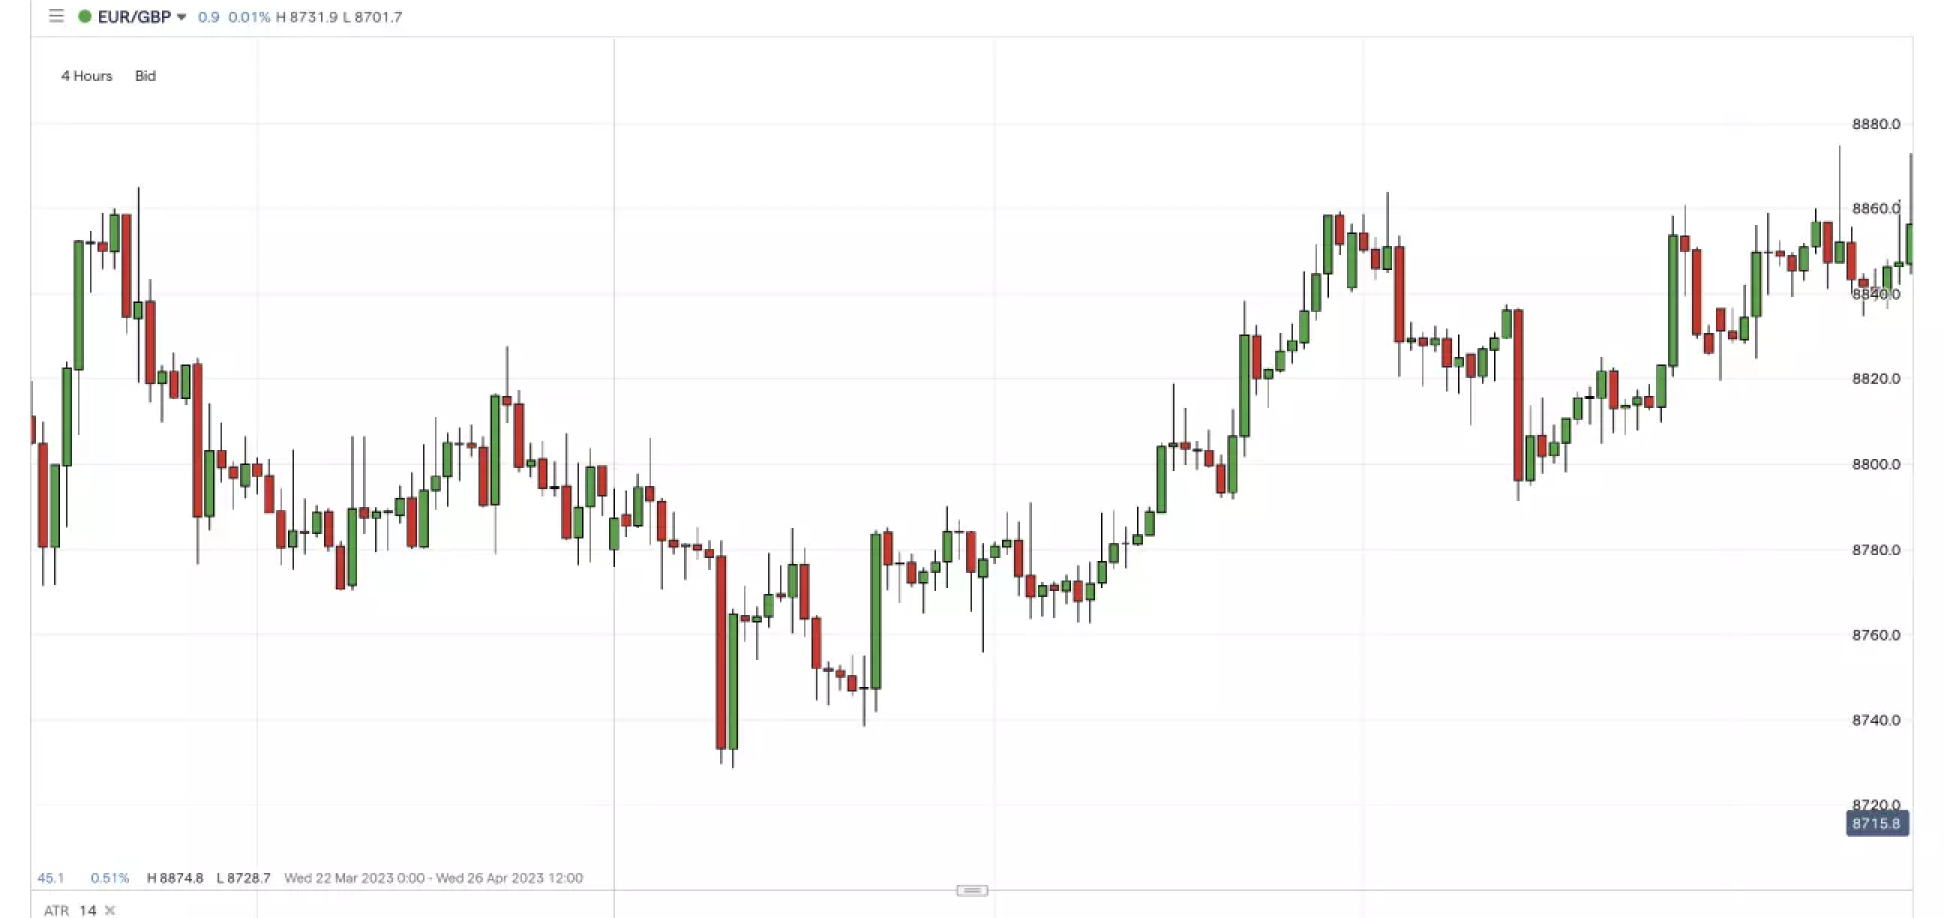
The average true range (ATR) is a forex indicator that measures market volatility. It shows how much a currency pair typically moves within a specific period. When the ATR value is high, it means the market is more volatile. A low ATR value indicates that the market is moving slowly and steadily.
Traders use ATR to manage their risk. For example, when the market is highly volatile, traders might place larger stop losses to avoid getting stopped out by sudden price swings. In contrast, during low volatility, they might use smaller stop losses. By applying the ATR indicator, traders better decide how much risk to take on each trade.
4. Moving Average Convergence/Divergence (MACD)
The moving average convergence/divergence (MACD) is a momentum indicator that shows the relationship between two moving averages. It consists of the MACD line, the signal line, and a histogram.
When the MACD line crosses above the signal line, it generates a buy signal, suggesting upward momentum. On the other hand, when the MACD line crosses below the signal line, it signals a potential sell opportunity. The histogram displays the difference between the two lines, making it easier to see changes in momentum.
The MACD is particularly useful for identifying trend reversals and spotting entry and exit points.
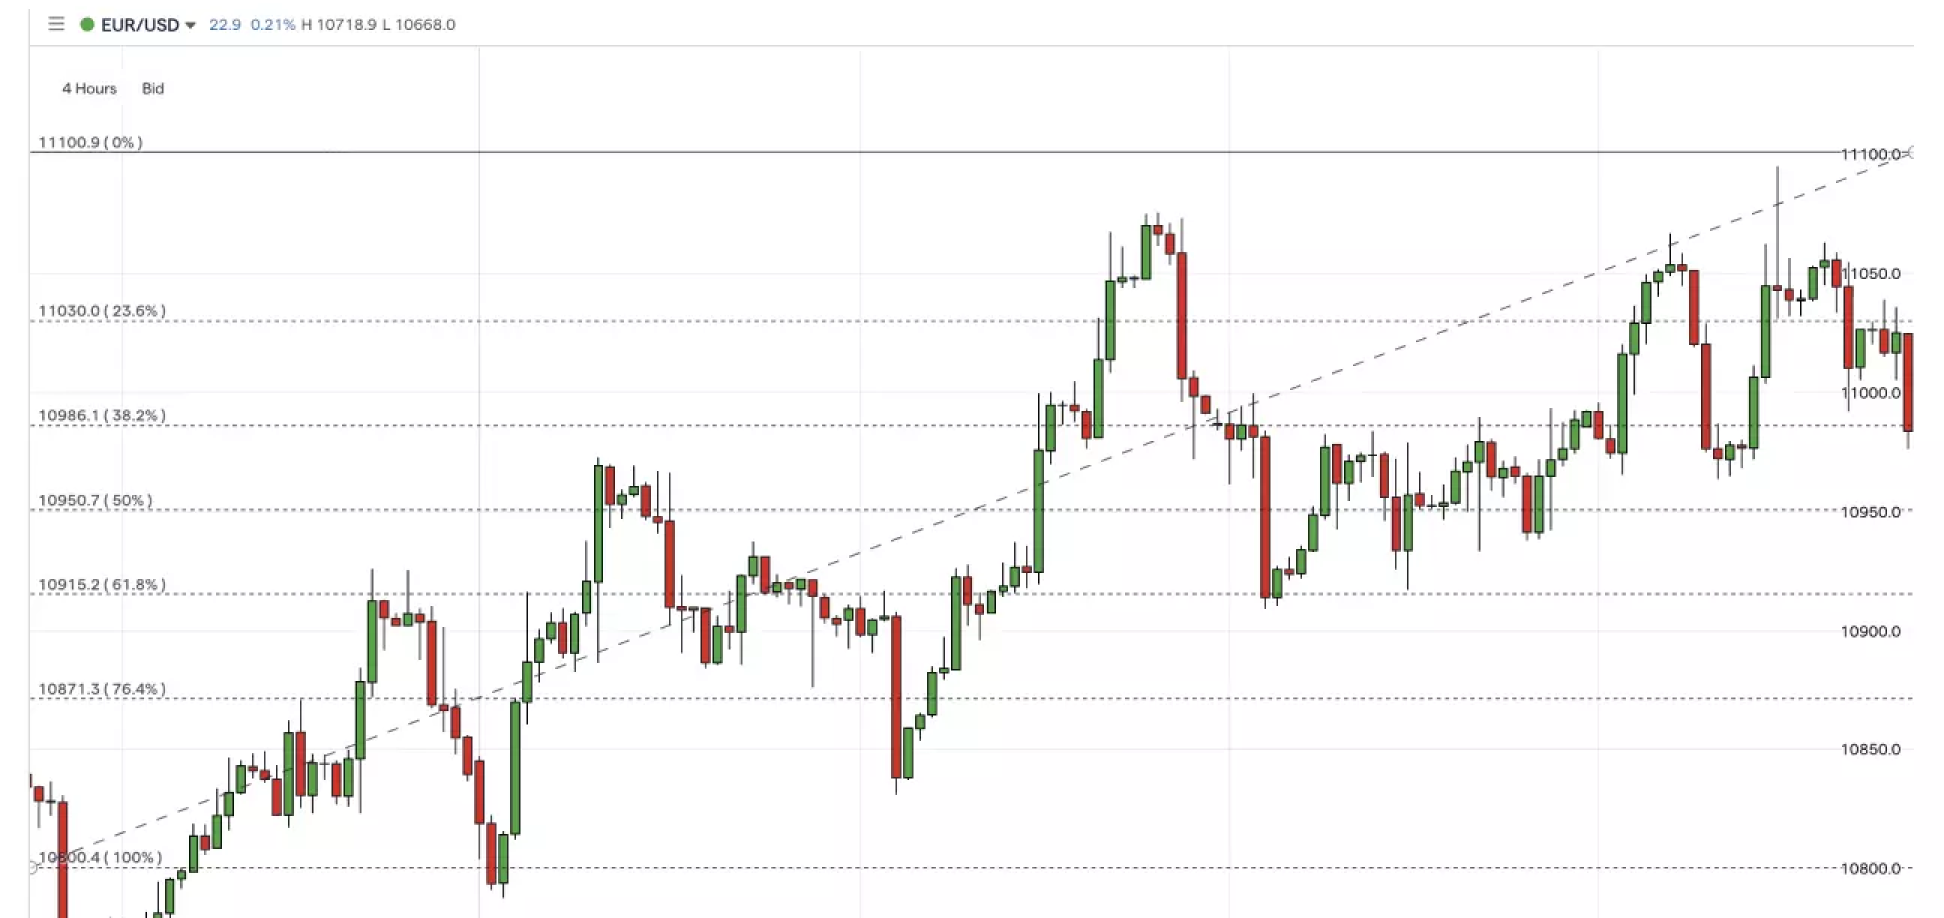
5. Fibonacci Retracements
Fibonacci retracements help traders identify potential support and resistance levels based on past price movements. This indicator uses horizontal lines on the chart at key Fibonacci levels, such as 23.6%, 38.2%, 50%, 61.8%, and 100%.
When the price retraces (pulls back) to one of these levels, it might bounce back and continue moving in the original direction. For example, if a currency pair is in an uptrend and retraces to the 61.8% level, traders might expect it to bounce back up. Similarly, in a downtrend, traders watch for price rebounds at these levels.
Fibonacci retracements help traders find potential entry and exit points by highlighting where the price might reverse.
6. Relative Strength Index (RSI)

The relative strength index (RSI) measures whether a currency pair is overbought or oversold. It ranges from 0 to 100, with levels above 70 indicating overbought conditions and levels below 30 signaling oversold conditions.
When the RSI moves above 70, it suggests that the price may soon drop, as the currency pair is overbought. Conversely, when the RSI falls below 30, it may signal a potential upward price movement, as the pair is oversold.
Traders use RSI to spot potential trend reversals and confirm buy or sell signals, making it a valuable tool in forex trading tools and indicators.
7. Pivot Point
The pivot point indicator helps traders identify possible support and resistance levels based on the previous trading session’s high, low, and closing prices.
If the current price moves above the pivot point, it suggests strong demand, signaling a possible uptrend. If the price falls below the pivot point, it indicates higher supply, suggesting a downtrend. The pivot point acts as a reference for traders to decide whether they should enter or exit a trade.
Traders use pivot points to predict market movements and set stop-loss and take-profit levels.
8. Stochastic
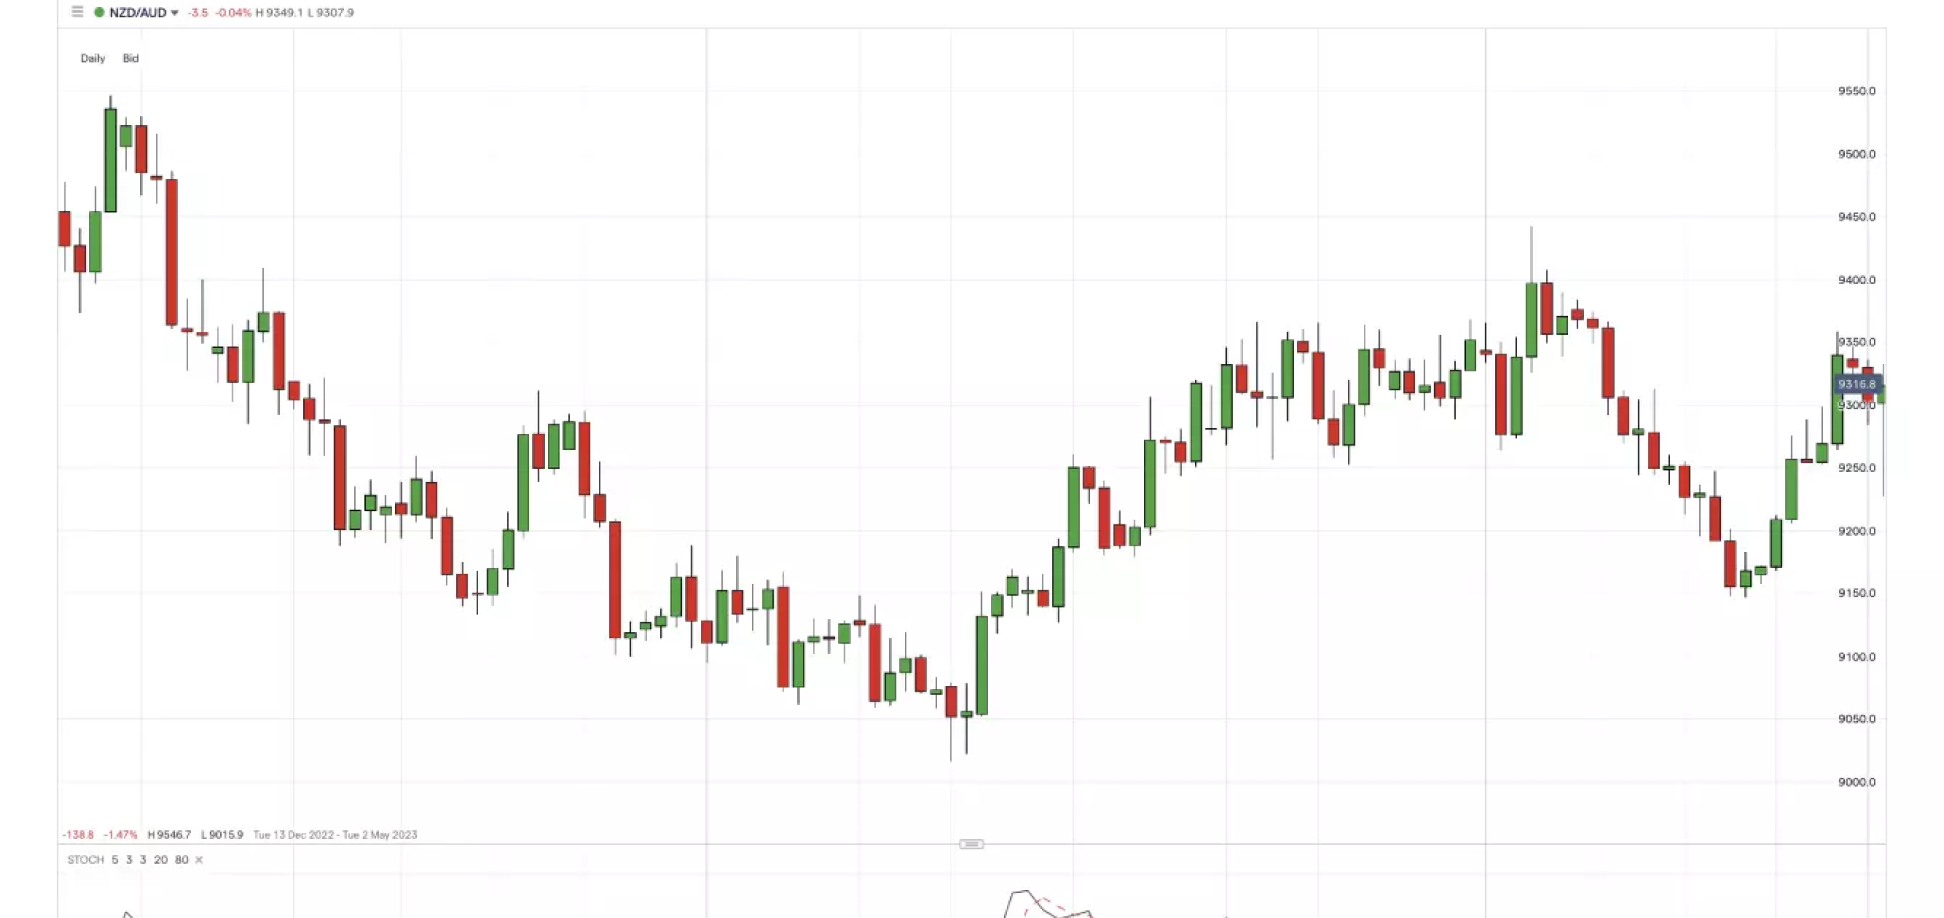
The stochastic oscillator measures the momentum of price movements. It ranges from 0 to 100 and helps traders identify overbought and oversold conditions. When the stochastic value is above 80, the market is considered overbought, which may signal a potential price drop. When the value is below 20, the market is seen as oversold, suggesting a possible price rise.
Traders also look for divergences between the stochastic and the price trend. For example, if the price is making higher highs but the stochastic is making lower highs, it may indicate weakening momentum and a possible trend reversal.
9. Parabolic SAR
The parabolic stop and reverse (SAR) is an indicator used to identify trend direction and potential reversal points. It appears as a series of dots on the chart, either above or below the price.
When the dots are below the price, it indicates an uptrend, signaling potential buy opportunities. When the dots are above the price, it suggests a downtrend, indicating possible sell signals.
The parabolic SAR helps traders place stop-loss orders and determine when to exit trades based on changing market trends.
10. Ichimoku Cloud
The Ichimoku Cloud is a multi-purpose forex indicator that shows support and resistance levels, trend direction, and momentum. It consists of five components:
- Tenkan-sen (conversion line): Measures short-term price movement.
- Kijun-sen (base line): Shows medium-term trend direction.
- Senkou Span A and B (leading spans): Form the cloud and highlight future support and resistance areas.
- Chikou Span (lagging span): Shows the current closing price plotted 26 periods back, indicating potential support and resistance
When the price is above the cloud, it signals an uptrend, while a price below the cloud indicates a downtrend. The Ichimoku Cloud offers traders a comprehensive view of market conditions in a single glance.
What’s the Best Forex Indicator?
The best forex indicator is the one that fits your trading style, goals, and risk tolerance. There is no single indicator that works perfectly for everyone. Some traders prefer trend-following indicators like moving averages, while others rely on momentum indicators such as the RSI. To find the right tool, you need to understand how forex trading indicators work and how they align with your strategy.
Using indicators helps you spot signals on when to enter and exit the market, as well as where to place stop-loss orders. Many traders use multiple indicators together for more accurate predictions. However, adding too many can lead to confusion and conflicting signals, making it harder to make clear decisions. The key is to strike a balance and choose a combination of forex trading tools and indicators that add value to your analysis.
How to Trade Using Forex Indicators
Trading with best forex trading tools and indicators helps you make smarter decisions by identifying trends, entry points, and potential reversals. By combining the right indicators with a solid strategy and proper risk management, you can increase your chances of making profitable trades. Here’s a simple guide on how to trade using forex indicators effectively.
- Choose a Forex Pair: Select the currency pair you want to trade, like EUR/USD or GBP/JPY.
- Analyze the Market: Apply forex trading indicators and combine them with fundamental analysis to spot trends and signals.
- Pick a Strategy: Use a trading strategy that fits your goals, such as trend-following or breakout trading.
- Manage Your Risk: Set stop-loss and take-profit levels to control potential losses and secure gains.
- Open and Monitor Your Trade: Place your trade and track its progress using indicators to make informed decisions.
- Close the Trade: Exit the trade when you reach your target or stop-loss level. Review your performance for future improvements.
Fundamental and Technical Analysis Forex Trading Tools
To succeed in forex trading, it is important to use the right tools. These tools help traders make informed decisions by analyzing the market from two key perspectives: fundamental analysis and technical analysis. Let’s explore the essential tools under both categories that help you trade effectively.
Fundamental Analysis Forex Trading Tools
Fundamental analysis focuses on real-world events, economic data, and financial news that influence currency prices.
Economic Calendar
An economic calendar is a tool that shows the dates and times of important financial events. It includes data releases such as employment figures, inflation rates, Gross Domestic Product (GDP), and central bank meetings. These events significantly impact currency prices. By tracking the economic calendar, traders prepare for potential market movements and make smarter trading decisions.
News Feeds
Staying updated with financial news is essential in forex trading. News feeds provide real-time updates on economic developments, political events, and financial reports. This information helps traders understand market sentiment and spot trading opportunities. For instance, a major policy announcement or unexpected geopolitical event cause sharp price movements, making news feeds a valuable tool for timely decision-making.
Notifications From Central Banks
Central banks play a major role in influencing currency prices through interest rates and monetary policies. When central banks announce changes in interest rates or release policy statements, it often triggers volatility in the forex market. By keeping track of these notifications, traders predict potential currency movements and adjust their strategies accordingly.
Technical Analysis Forex Trading Tools
Technical analysis deals with studying price patterns, trends, and historical data to predict future movements.
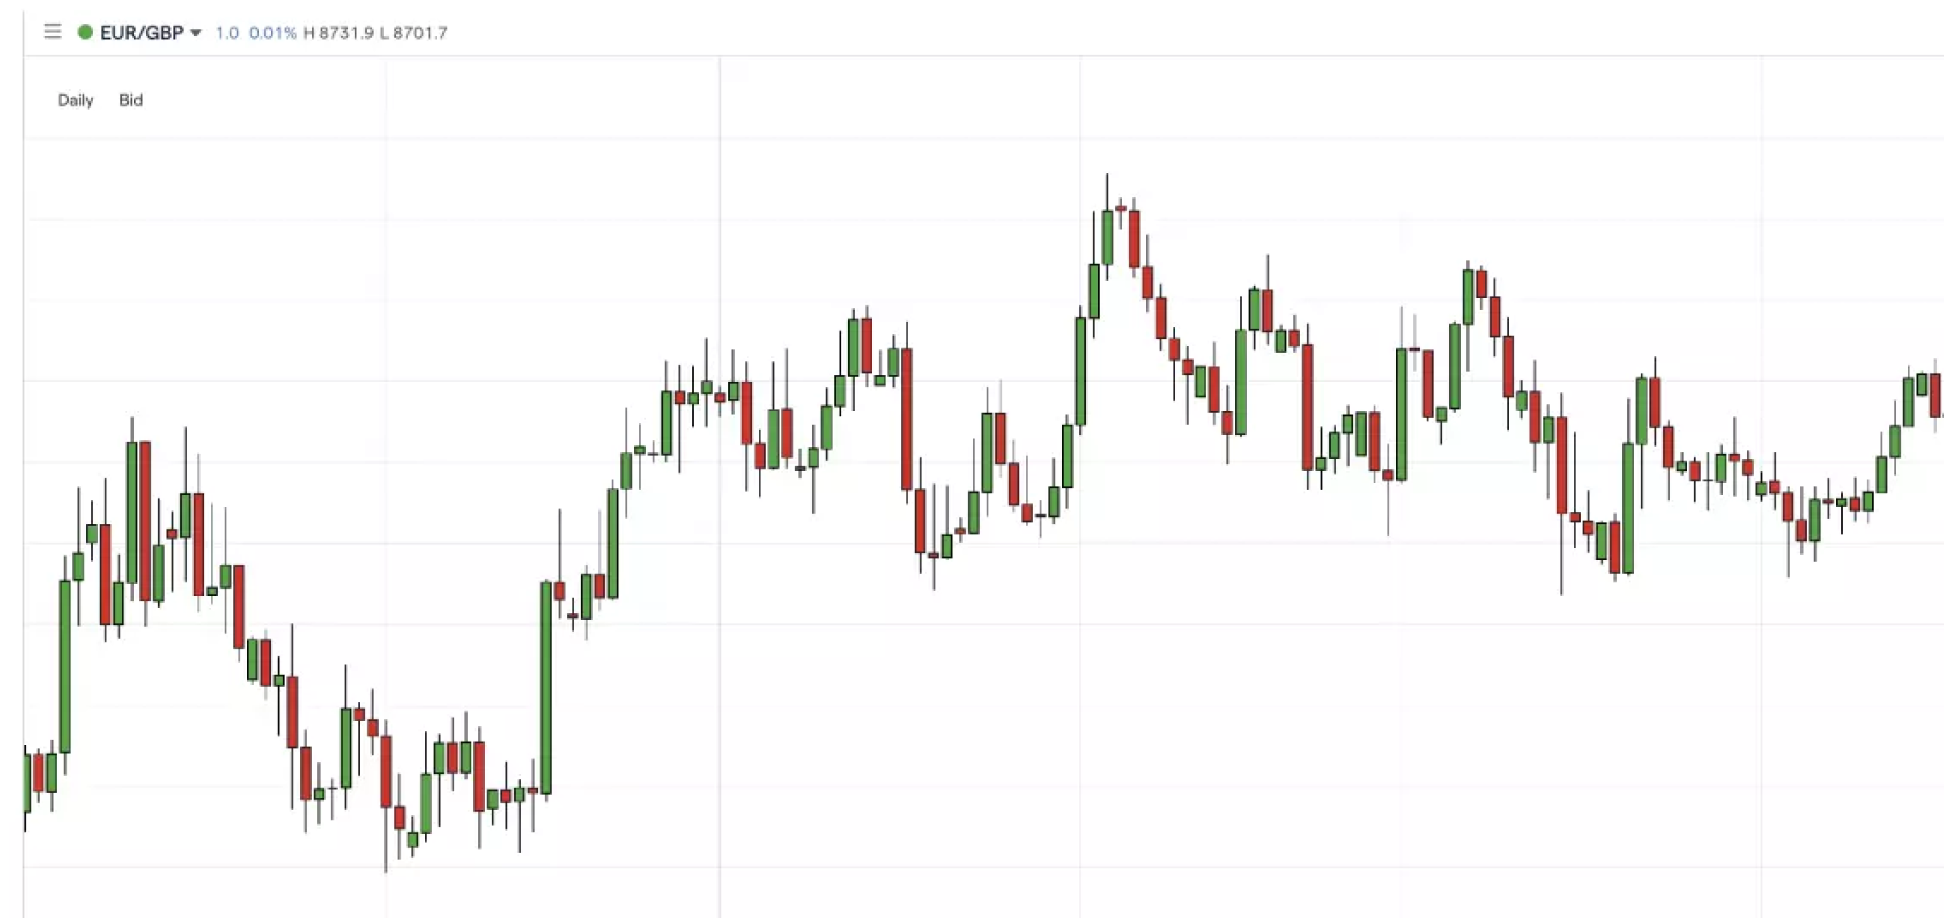
Candlestick Charts
Candlestick charts are a popular tool in technical analysis. They show price movements over a specific period using candle-shaped symbols. Each candle represents the opening, closing, high, and low prices. By analyzing candlestick patterns, traders can identify trends, potential reversals, and market sentiment. For example, a bullish engulfing pattern may signal a potential upward trend, while a doji pattern may indicate market indecision.
Trend Indicators
Trend indicators help traders identify the overall market direction. Tools like Moving Averages and the Ichimoku Cloud are commonly used. Moving Averages smooth out price fluctuations, making it easier to spot trends. The Ichimoku Cloud offers a broader view by showing support, resistance levels, and possible trend changes. By using trend indicators, traders align their trades with the prevailing market direction.
Oscillators
Oscillators measure the momentum of price movements and indicate whether a currency pair is overbought or oversold. Common oscillators include the Relative Strength Index (RSI) and the Stochastic Oscillator. When RSI moves above 70, it signals that the market may be overbought, indicating a possible price drop. Conversely, if it drops below 30, the market may be oversold, suggesting a potential price increase.
Support and Resistance Tools
Support and resistance tools help traders identify key price levels where the market is likely to reverse or consolidate. Support refers to a price level where buying interest is strong enough to prevent further decline, while resistance is a level where selling interest stops further price increases. By recognizing these levels, traders make better decisions on where to enter and exit trades.
Using a combination of fundamental and technical analysis tools helps traders develop a well-rounded strategy. Fundamental tools keep traders informed about market-moving events, while technical tools assist in identifying patterns and trends. Together, they offer valuable insights to enhance trading accuracy and reduce risks.
Trading Platforms in Forex Trading
Choosing the right trading platform is essential for a smooth and efficient forex trading experience. A trading platform is the software that allows traders to access the forex market, place orders, and monitor their trades. The platform's features, interface, and tools significantly impact a trader's decision-making process. Let’s explore four popular trading platforms used by forex traders worldwide.
MetaTrader 4 (MT4)
MetaTrader 4 (MT4) is one of the most widely used forex trading platforms. It offers a user-friendly interface along with powerful features, making it a popular choice among both beginners and experienced traders. MT4 provides advanced charting tools, technical indicators, and customisable templates that help traders analyse the market effectively.
One of its standout features is the use of Expert Advisors (EAs), which enable automated trading. With EAs, traders create and implement automated strategies based on pre-set rules, reducing the need for manual intervention. MT4's simplicity and reliability make it a preferred platform for many forex traders.
MetaTrader 5 (MT5)
MetaTrader 5 (MT5) is the advanced version of MT4, offering more features and flexibility. It includes additional timeframes, a larger selection of technical indicators, and an expanded range of trading instruments. With MT5, traders access not only forex pairs but also stocks, futures, and commodities, all within the same platform. This makes it ideal for traders who want to diversify their portfolios. MT5 also offers improved backtesting capabilities and more charting options, making it a powerful tool for conducting in-depth market analysis.
cTrader
cTrader is a platform known for its intuitive interface and advanced trading capabilities. It offers Level II pricing, which provides more transparent market data by showing the full range of available prices. cTrader also comes with advanced charting tools and a user-friendly algorithmic trading environment, making it popular among ECN (Electronic Communication Network) traders. The platform is designed for speed and efficiency, making it ideal for traders who want fast order execution and access to real-time market data.
NinjaTrader
NinjaTrader is a versatile trading platform suitable for both beginners and experienced traders. It offers advanced charting and analysis tools, making it a great choice for technical traders. NinjaTrader provides a wide range of technical drawing tools and indicators, allowing traders to perform detailed market analysis.
The platform also supports automated trading strategies and includes a built-in scripting language, which enables traders to create custom strategies and indicators. With its comprehensive features, NinjaTrader is a powerful platform for traders who want flexibility and precision in their trading activities.
Algorithmic Forex Trading Tools
Algorithmic trading tools help automate trading decisions, making it possible to execute trades without constant market monitoring. These tools rely on pre-defined rules, strategies, and algorithms to analyse market conditions and place trades automatically. This reduces emotional trading and allows for faster and more efficient trade execution. Let’s explore some popular algorithms with the best forex trading tools.
Expert Advisors (EAs)
Expert Advisors (EAs) are pre-coded scripts designed to follow specific trading strategies. Once activated, EAs monitor the market, identify trading opportunities, and execute trades automatically. This hands-free trading approach reduces the need for manual intervention, making it ideal for traders who cannot monitor the market continuously. EAs are particularly useful for applying consistent strategies, as they eliminate emotional biases from trading decisions.
Forex Robots
Forex robots are automated systems that analyse market conditions and execute trades based on pre-set strategies and historical data. These robots are designed to work around the clock, ensuring that trading opportunities are not missed. Traders choose from a variety of forex robots, each tailored to different trading styles and risk levels. While forex robots boost trading efficiency, it is important to test them thoroughly to ensure they align with your trading goals.
Custom Scripting
Custom scripting offers traders the flexibility to create their own automated trading algorithms. By using programming languages like MQL4, MQL5, or Python, traders build personalised strategies based on their specific market insights and preferences. This tool is especially valuable for experienced traders and developers who want full control over their trading systems. Custom scripts allow for unique strategies that may not be available in pre-built tools, offering a competitive edge.
Risk Management Forex Trading Tools
Risk management tools help protect your capital and minimize losses while navigating the unpredictable forex market. These tools allow traders to set limits, control trade sizes, and evaluate potential risks before entering a position. By using them effectively with the guide of best Forex Trading in UAE, traders preserve their funds and trade with more confidence. Let’s explore some essential risk management with the best forex trading tools.
Stop-loss and Take-profit Orders
Stop-loss and take-profit orders help you manage trade outcomes automatically.
- A Stop-loss order sets a price limit where your trade automatically closes if the market moves against you. This prevents further losses and protects your capital.
- A Take-profit order defines the price at which your trade closes once the market moves in your favour. This ensures that you lock in profits without having to monitor the trade constantly.
Position Sizing Calculators
Position sizing calculators help you decide the right trade size based on your risk tolerance and account balance. By entering details like your capital, risk percentage, and stop-loss distance, these calculators determine how much you should trade. This prevents you from overexposing your account to a single trade, reducing the chances of major losses.
Risk-reward Ratio Calculators
Risk-reward ratio calculators allow you to assess the potential profitability of a trade by comparing the possible gain against the possible loss. By entering your entry price, stop-loss, and take-profit levels, you can quickly evaluate whether the trade offers a favourable risk-to-reward ratio. This helps you make informed decisions and stick to a balanced trading plan.
Economic News and Charting Forex Trading Tools
Economic news and charting tools help forex traders stay informed about market-moving events and analyse price trends. These tools provide real-time data, financial news, and visual insights to support smarter trading decisions. Let’s explore some essential forex trading tools in these categories.
Forex Factory
Forex Factory is a popular platform for real-time economic news and data. It features an economic calendar that highlights major events like GDP releases, interest rate decisions, and employment reports. Traders use this tool to anticipate market volatility and plan their trades accordingly. The platform also offers forum discussions where traders share insights on market sentiment and potential impacts.
Investing.com
Investing.com offers financial news, real-time data, and market analysis. It covers a wide range of economic events, currency pairs, and financial instruments. Traders can use this tool to access live data, charts, and forecasts, helping them stay updated on market trends and make informed trading decisions.
DailyFX
DailyFX provides expert analysis, educational content, and real-time insights for forex and CFD markets. It offers economic calendars, news updates, and trading forecasts. Traders use DailyFX to gain valuable market insights and identify potential trading opportunities. The platform’s research articles and reports help traders understand how economic events affect currency movements.
Charting Software
TradingView
TradingView is a popular charting platform with advanced technical analysis tools. It offers a variety of indicators, drawing options, and chart types. Its user-friendly interface makes it ideal for traders of all experience levels. TradingView also allows users to share their analyses and strategies with a global community of traders.
MultiCharts
MultiCharts is known for its advanced charting and back-testing capabilities. It allows traders to test their strategies on historical data, helping them evaluate the effectiveness of their trading approaches. This feature enables traders to fine-tune their strategies before applying them in the live market.
Thinkorswim
Thinkorswim, by TD Ameritrade, offers powerful charting and analysis features. It provides a range of technical studies, customizable chart layouts, and simulated trading modes. The platform is popular with both experienced and novice traders, as it offers tools for practicing and refining trading strategies.
Trade Journals and Performance Analysis Tools
Trade journals and performance analysis tools help forex traders track their trades, analyse performance, and improve their strategies. These tools provide valuable insights into trading patterns, psychological tendencies, and decision-making processes. Let’s explore some popular tools that assist traders in refining their forex trading skills.
MyFxBook
MyFxBook is a comprehensive trade tracking and analysis tool. It automatically syncs with your trading accounts, eliminating the need for manual data entry. The platform generates detailed performance reports, including win rates, drawdowns, and risk-reward ratios. Traders also share their trading results with others, fostering a collaborative learning environment.
Edgewonk
Edgewonk is a trading journal with psychological insights. It goes beyond just recording trades by allowing you to log emotions, thoughts, and external influences. This helps traders identify behavioural patterns, such as overtrading or emotional decision-making. By addressing these patterns, Edgewonk assists in improving trading discipline and consistency.
Tradervue
Tradervue acts as a digital trading journal that records every trade along with the rationale behind it. It offers a trade playback feature, allowing traders to review their decisions step by step. This helps them analyse their strengths, weaknesses, and areas for improvement.
How to Choose the Best Forex Tools and Software
Choosing the right forex tools and software is crucial for successful trading. To make the best decision, consider factors like ease of use, accuracy, and price. Here’s how to evaluate them effectively.
Ease of Use
Select forex tools that have a simple and intuitive interface. Complicated software slow you down and lead to errors. Easy-to-use platforms like ours Forex Trading in UAE help you focus on trading decisions rather than dealing with confusing features, making your trading experience smoother.
Accuracy
Accurate data is key in forex trading. Choose tools that provide real-time market data, precise forecasts, and reliable analysis. Accurate tools help you make informed decisions and reduce the risk of errors.
Price
Consider the cost and value of the forex tools with Forex Trading in UAE. Some platforms offer free versions with basic features, while others have premium plans. Assess your budget and choose software that provides the best balance of cost and functionality.
FAQ
Can Forex Trading Tools generate profit?
Yes, the best forex trading tools help you make profitable trades by providing accurate data, market insights, and automated strategies. However, they do not guarantee profits. Success depends on how effectively you use the tools alongside proper risk management and trading skills.
How is the Forex Trading market different from other markets?
The forex market is open 24 hours a day, five days a week, unlike stock markets with fixed trading hours. It involves currency pairs rather than individual stocks or commodities. Additionally, forex trading offers higher liquidity and more frequent price movements.
What’s the most accurate forex indicator?
There is no single "most accurate" indicator, as their effectiveness depends on the market conditions and trading strategy Forex. However, indicators like the Relative Strength Index (RSI) and Moving Averages are widely used for their accuracy in identifying trends and reversals.
What’s the best indicator for forex trading?
The best indicator varies based on your trading style. For trend traders, Moving Averages or the MACD are effective. For momentum traders, RSI and Stochastic Oscillator work well. Combining multiple indicators enhances accuracy.
Where can I get forex signals?
You can get forex signals from specialised platforms and services, such as Forex Factory, Investing.com, and DailyFX. Many brokers and trading platforms also offer real-time signals. You can also join forex signal groups on social media and trading forums.
Do you need indicators for forex trading?
No, indicators are not mandatory, but they help improve trading accuracy. Some traders rely on price action or fundamental analysis instead. However, using indicators offers additional insights into market trends and potential entry or exit points.
Conclusion
The best Forex trading in UAE tools and software play a crucial role in helping traders make smarter and more informed decisions. From fundamental and technical analysis tools to risk management and trade journals, each tool offers valuable insights and enhances your trading efficiency. By using the right combination of tools, you can track market trends, manage risks, and optimize your strategies effectively.
However, while these Forex Trading in UAE tools can improve your accuracy and performance, they are not a guarantee for success. Consistent learning, practice, and proper risk management are key to long-term profitability. With the right tools and a well-planned strategy, you can navigate the forex market confidently and make better trading decisions.